How to sort by rating
Sometimes there's one good way to do something and many poor ways (like chosing the right CSV delimiter). I really like Evan Miller's post about how to sort ratings and will try to outline the idea and show an example with a star-based rating.
The problem
The problem: What is the right way to sort items (products, comments, ...) with an average rating by n users?
By the right way, I mean rating items in the most helpful way for other users - by providing reliable information about the quality of an item (quality as perceived by the users, we don't know anything real about the quality of the item).
Obiously both of the factors - average rating and the number of users - matter. A single 5 star rating isn't nearly as trustworthy as 20 ratings with an average of 4.8 stars, which intuitively makes sense. Also, an average rating of 4 should be ranked higher than an average of 3.5 with roughly the same amount of users.
An example: sorting products
Let's take the swiss online shop Digitec as an example. Searching for "Nexus" yields some results, for example the Tablet Nexus 9 and the Phone Nexus 6:
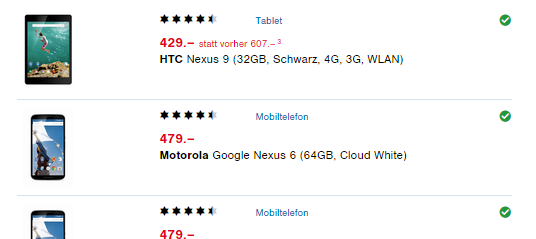
The rating for each is rounded to 4.5 stars each, but on the product site you can see the individual ratings, and they average as follows:
- Nexus 9 Tablet: 4.57 / 5 stars, rated by 7 users
- Nexus 6 Phone: 4.48 / 5 stars, rated by 54 users
We have an average rating of n users, but how sure can we be this matches the real rating? What we're really interested in, is the hidden, real rating of the item!
For example, if we take all the customers of a product and compare it to those who actually submit a review, it makes sense that the bigger the number of users who gave a review, the more accurate (= nearer to the real rating) our average rating is:
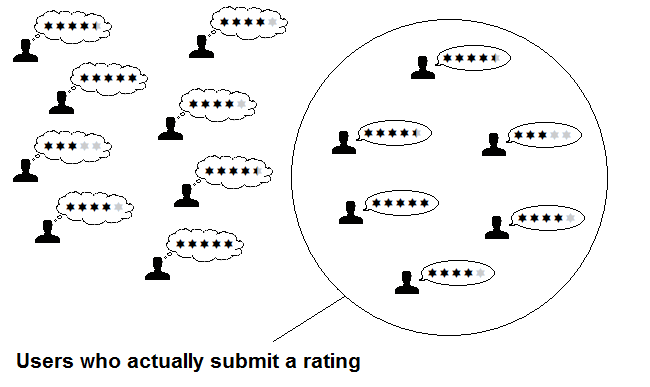
Chances are that we were unlucky and just picked some users with extreme ratings, then our average will be too high or too low.
To be totally sure we get the real rating, we'd have to ask all the people who bought it, but that information is not available. But if we say, we want to be 95% sure that our calculated average rating isn't lower than a certain bound?
We also should think about how that group is chosen from the total of all customers. Because the group is likely to be biased (maybe users with a negative experience are more likely to share it etc.) we can't really make any assumptions about the underlying distribution and therefore interpret our values as parameters for a confidence interval for an unknown p of a binomial distribution.
The solution
The solution: We calculate a lower bound, given the average rating and our n users, that we can at least be 95% (or 90% or whatever) sure that the real rating isn't below this bound!
To be exact, we need the lower bound of the α-binomial proportion confidence interval (with our parameters average rating and n). To our two factors a third comes into play, α, which indicates how sure we want to be. A common value is 95%, so that in 95% of the cases (on average) we're right.
We can approximate this lower bound with the Clopper-Pearson interval or another method (like Wilson's interval). This gets us the following (for code see below):
- Tablet: 4.57 / 5 with 7 ratings: real rating is at least 2.84 stars (with 95% certainty)
- Phone: 4.48 / 5 with 54 ratings: real rating is at least 4.00 stars (with 95% certainty)
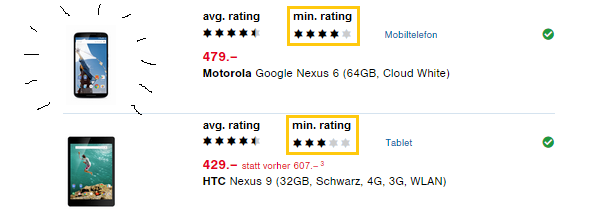
Result
The Nexus 9 Tablet only got a lower bound of 2.84 stars (which could be expected with only 7 ratings), whereas the Nexus 6 Phone scores 4 stars! So the Phone should be clearly higher ranked than the Tablet:
Code and appendix
We can express the Clopper-Pearson interval in terms of the beta distribution, as stated in Wikipedia, which gives us for the lower bound:
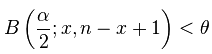
where x is the number of successes in a binary (+/-) rating system and n is the number of ratings. Translated to our star-based rating system (see also here) this turns into:
stats.beta.ppf(alpha / 2, rating*n, n - rating*n + 1)Also, because 1 star is the lowest rating, we have to normalize the 1 to 5 star ratings to a [0, 1] interval with
rating = (rating-1)/4

Python code for this example (2.7, requires [scipy](http://www.scipy.org/) for the beta function):

```python
from __future__ import division
import scipy.stats as stats

def lower_bounds(rating, n, alpha=0.05):
    ''' Assuming a 1 to 5 star-rating '''
    rating = (rating-1)/4
    ci_low = stats.beta.ppf(alpha / 2, rating*n, n - rating*n + 1)
    return ci_low*4 + 1

items = [['Nexus Tablet', 32/7, 7], ['Nexus Phone', 242/54, 54]]
for i in range(len(items)):
    items[i] = items[i] + [lower_bounds(items[i][1], items[i][2])]

for item in sorted(items, key=lambda x: x[3], reverse=True):
    print item
Returns the following (name, avg. rating, # of ratings, lower bound):
['Nexus Phone', 4.481481481481482, 54, 4.0039512303867282]
['Nexus Tablet', 4.571428571428571, 7, 2.8357283010686061]
Thanks for reading!
