Assessing used car offers
This summer, me and my wife decided to get a bigger car, to have a bit more space for the buggy and some baggage, also for going on holidays. I tried to figure out a way to assess the cost effectiveness of used car orders, and this is the result:
One of the most popular family cars here in Switzerland is the Škoda Octavia, one reason being the good cost effectiveness, so we were looking mainly for a used Octavia.
Luckily, there is a single portal which shows all used Octavia cars in Switzerland: occasionen.caroffer.ch.
After having a look through some of the offers, we wondered which of them were actually good offers and which ones weren't. How could we figure that out?
What is a good offer?
The first thing to do was to gather some data and evaluate it. I decided to go with a simple scoring method and only take into account two variables: mileage and age.
Using multiple linear regression with mileage and age as weighted parameters, it would give a factor which could then be used to calculate the expected used price based on the new price.
Example: If the mileage/age factor was 0.75 (evaluated with our training data), then based from an original price of CHF 20'000, the expected used price would be CHF 15'000. If the offer then actually was 16'500, we knew the offer wasn't that good.
After scraping the site for all available Octavia offers, I ended up with some data which looked like this:
age (months), mileage (1000 km), price_factor
5,8,0.8657776238309663
8,7,0.7901498929336188
9,11.9,0.7555362570560139
14,19.9,0.7577665827036104
19,28.9,0.7001009081735621
20,12,0.6978759083286752
25,76.5,0.5748861730170142
28,18.2,0.7637292464878672
36,34.1,0.6854166666666667
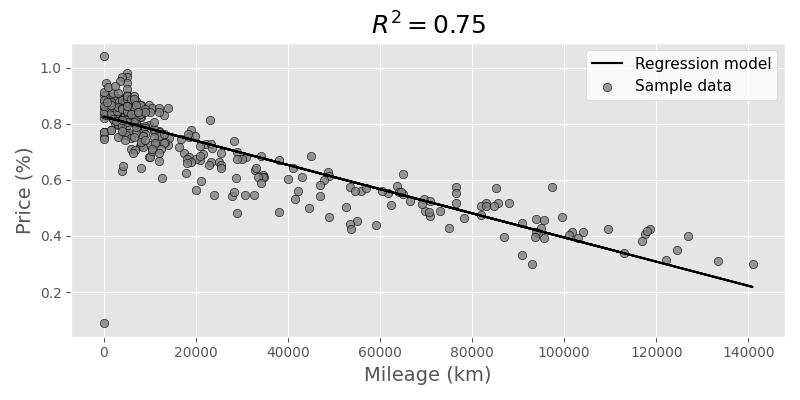
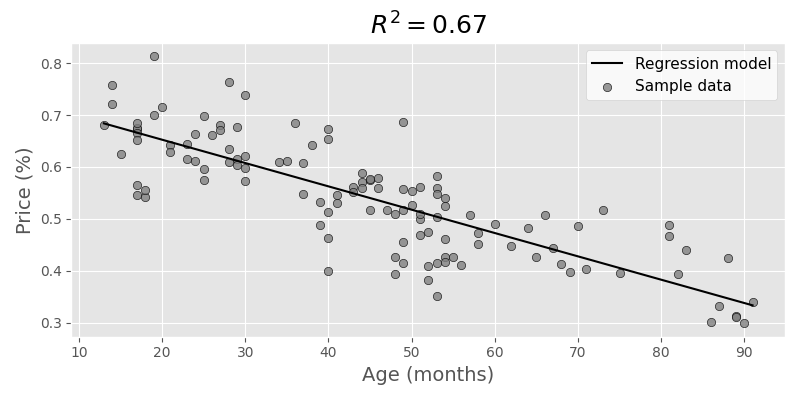
...Having a quick look at the data, we see that it might actually be quite linear for the big part, but in the beginning it's definitely not. Mileage correlation (code adapted from source):
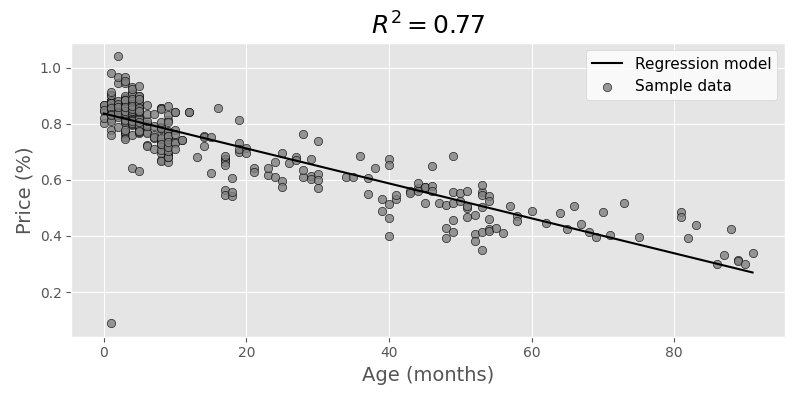
Age correlation:
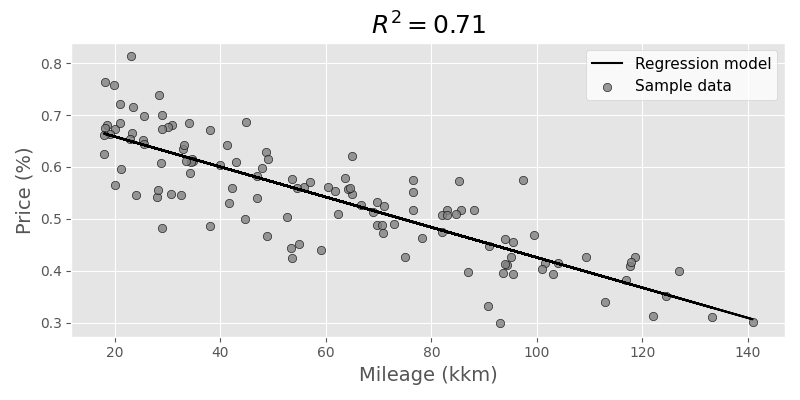
With setting some arbitrary minimum age (1 year) and mileage (15k km) we get some trimmed data, and we can do a linear regression, for example using statsmodels:
import numpy as np
import statsmodels.api as sm
import pandas as pd

df = pd.read_csv('octavia_data.csv')
x = np.array([df['age'].values, df['mileage'].values]).T
x = sm.add_constant(x)

y = np.array(df['price_percent'].values)

results = sm.OLS(endog=y, exog=x).fit()
print(results.summary())
This results in the following formula:
price_factor = 0.7637 - 0.0025 × age - 0.0018 × mileage
(where age is in months and mileage is in 1000 kilometers)
The graphs now look like this:
We can also show both parameters in regards to the price factor, resulting in a 3D graph:
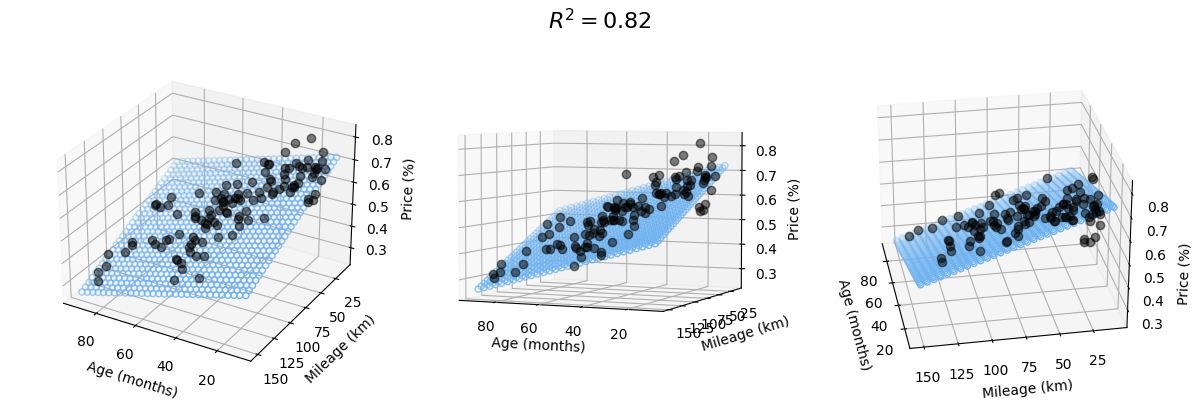
Although very simplified, we can still draw some conclusions:
- When a new car is sold, it immediately loses value. The linear model assumes more than 16-24% loss (depending on what data we take), even if age and mileage are both very low.
- There's a lot of variance in both low age and low mileage, and this is where the model does a poor job with prediction. Luckily this was not really relevant for us as the price level for nearly unused cars is still pretty high.
- The summary from statsmodels hints at multicollinearity, which obviously makes sense, older cars tend to have more mileage. The model is still a bit more accurate though when taking into accounts both parameters (age and mileage) to compare actual and expected price.
Automated notifications
After I knew how to evaluate new cars, I spun up a little Telegram bot to send out a notification once something interesting came up. One thing that also came in handy was that our own criteria could also be included (like mileage < 100'000 km, price < 20'000 etc.) so we would only get a notification if something interesting showed up.
After searching for some months (with good results from the bot!), we unexpectedly ended up with a Toyota Avensis (which is very similar to the Octavia) - we got a surprise offer from our garage with a good price.
You can find the code for fetching data and creating the graphics here.
