Four color theorem - map solver
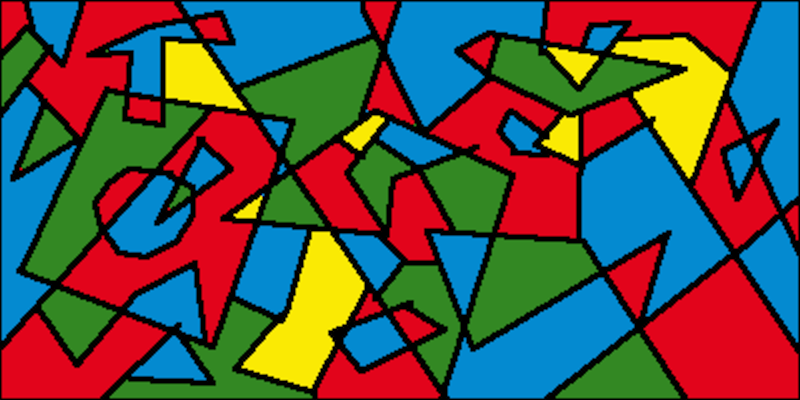
Every map is colorable with 4 colors. (Four color theorem)
Try it yourself
Draw lines on the canvas and after you've finished, click solve to color the map.
Note: Backtracking may take some time and may not always find a solution in time (10s max).
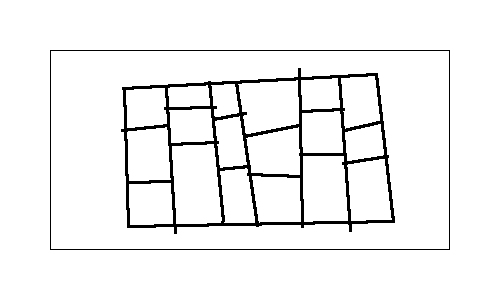
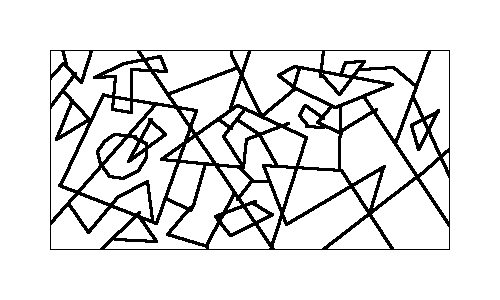
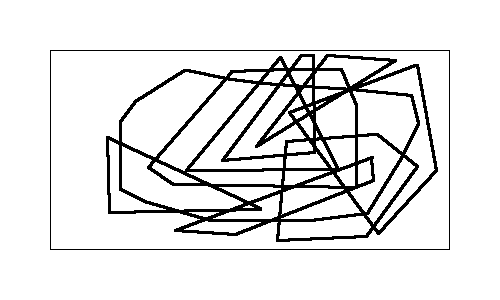
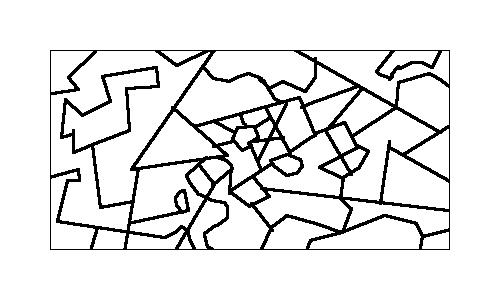
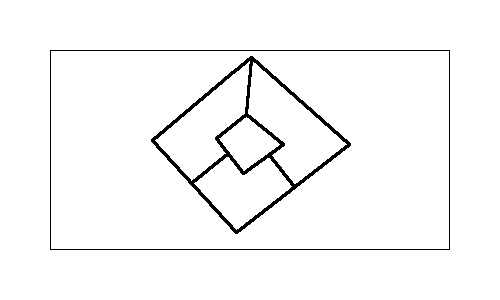
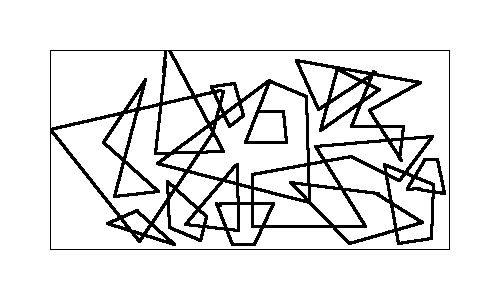
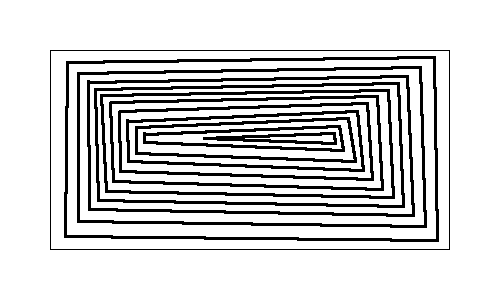
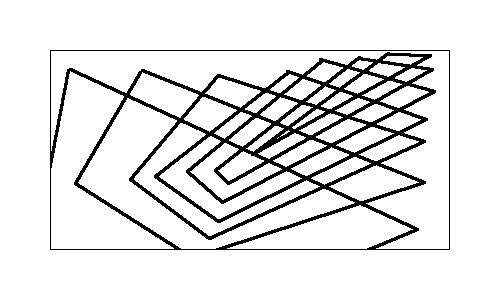
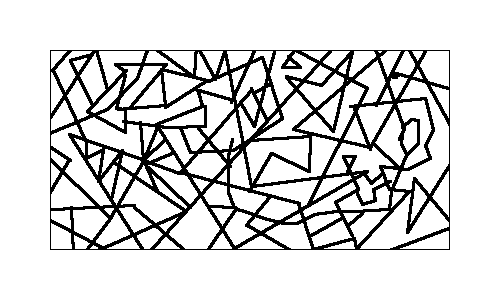
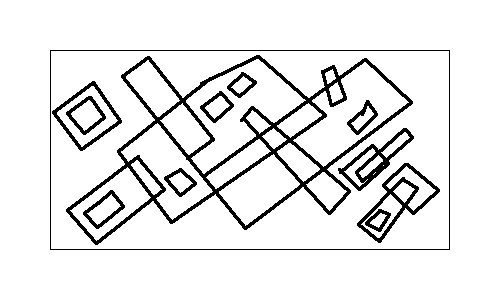
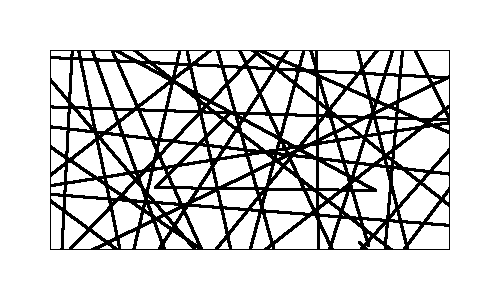
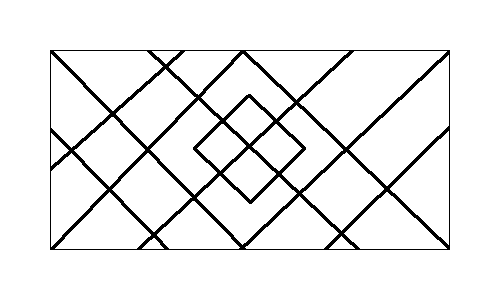
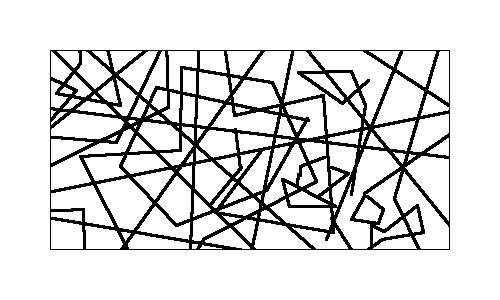
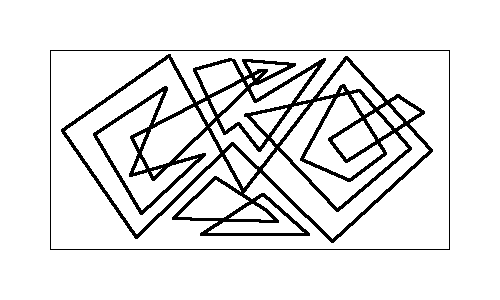
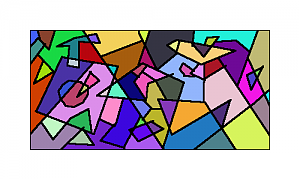
Some more examples
Click an image to load it onto the canvas:
How it works
The coloring and canvas handling is powered by ProcessingJS. The steps for solving a graph are the following:
- Find areas (nodes) using flood fill (BFS)
- Find neighbors (edges) using "marginal points" for each area within distance
- Build inner graph representation
- Solve graph with Welsh-Powell and if this fails, try backtracking
- Display results on canvas

Finding areas
For drawing straight lines, the Bresenham's line algorithm is used:
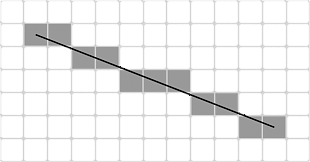
Image from Wikipedia
It's necessary to have clear borders for finding distinct areas, and also for the examination of neighbor. As you can see, the line is a bit thicker so they are clearly visible and also we can avoid some nasty 1-pixel-diagonal problems.
Once there are clear borders, it's easy to analyze the grid for white space and using flood fill if a new area is found:

Image by André Karwath
Finding neighbors
Finding the neighbors is the hard part. Generally, if two areas have some pixels which lie near enough beside each other, they can be considered neighbors. Now it doesn't make sense to check for every possible pixel, just checking the outermost, "marginal" pixels is enough, and if we found two pixels from different areas which have a distance smaller enough that we now that there's just a line between them.
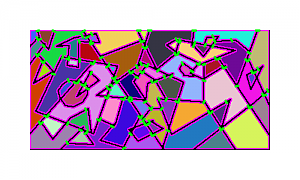
In the right image, all border pixels are marked pink, and the bright green lines mark a connection between two areas, an edge.
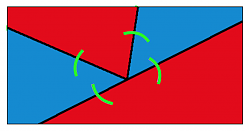
Also, as the theorem states, two areas need to share a common border, just a common interception is not enough. That's why 2 colors would be enough for the following graph, the 2 red and the 2 blue areas don't count as each others neighbors.
Solving the graph
Once we have a graph, we only need to color it and draw the results back to the canvas. A fast, but not optimal coloring gives the Welsh-Powell algorithm, for many cases it colors the graph with 4 colors.
For more complex graphs, backtracking is used: We just begin by coloring a first node, color the next one with the lowest color available which is allowed and then just continue, until we see if we can get a complete graph or if we have to go back and try another color.
All the code is also on Github. Thanks for reading!
